TEAM
Two designers: me and my design manager
RLDatix makes software for hospitals and healthcare teams. Its tools help them manage safety, risk and staffing.
During COVID-19, I was one of two designers on the risk platform. I led research and design, from shared patterns to how people review risks and report incidents.
Two designers: me and my design manager
Research, interaction design, UI library, usability testing
Product, Engineering, support and clinical experts
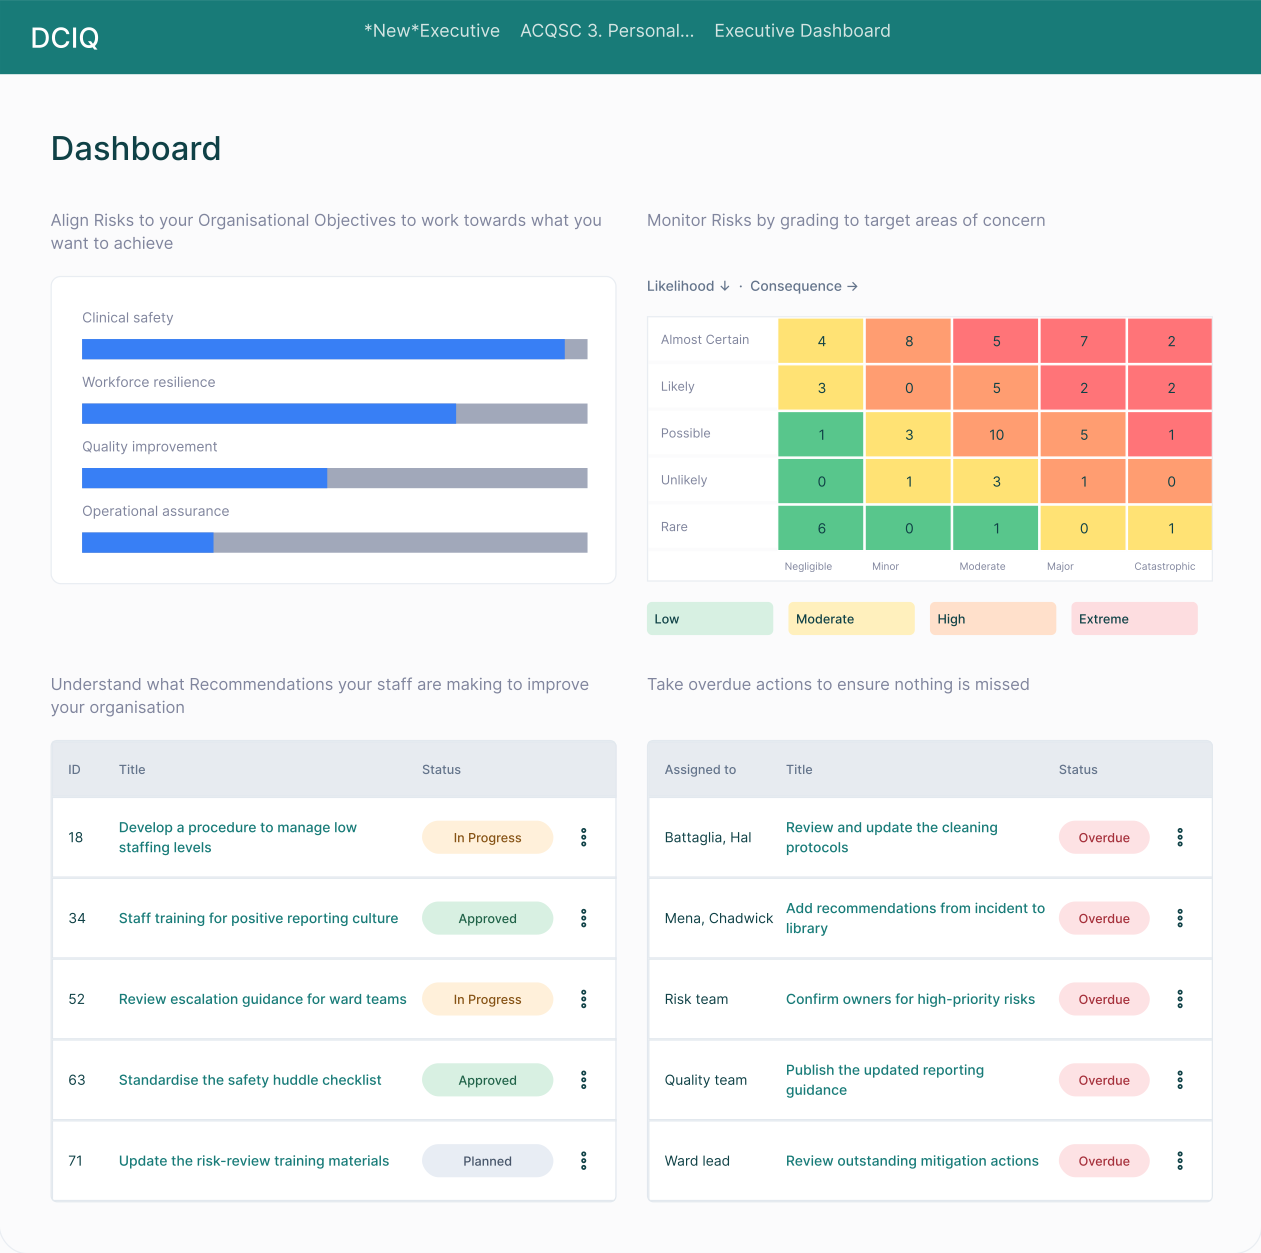
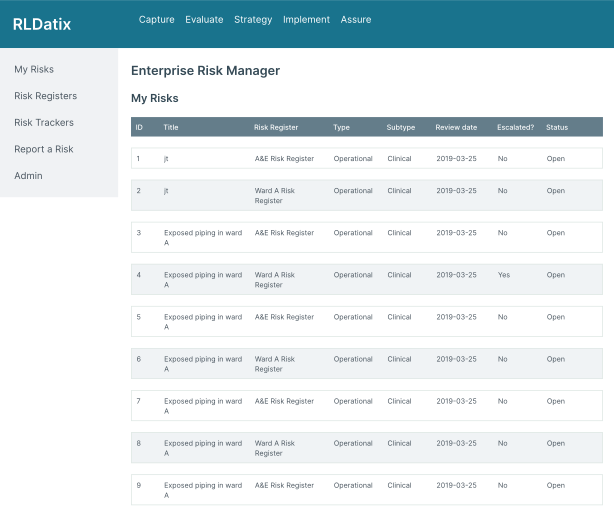
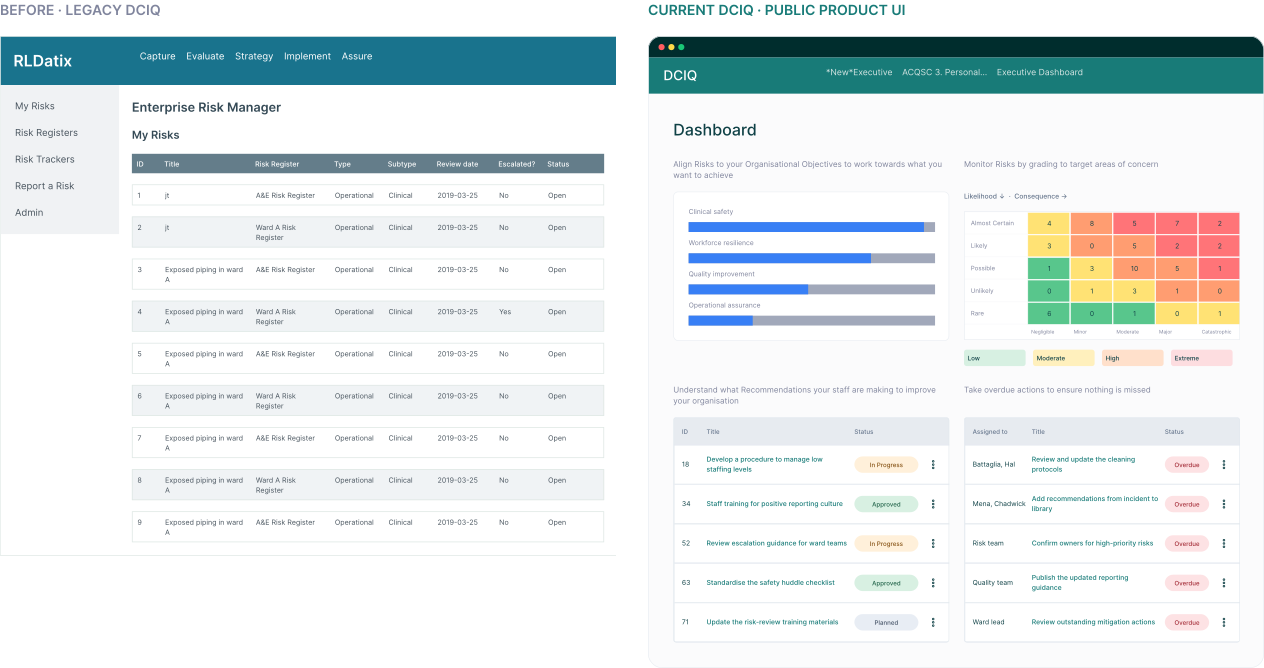
Explore two screens: a legacy risk register and a later public dashboard. They show the kinds of work in the platform, not a direct before-and-after of one screen.
Tested Icon Wall template creation and management with four major clients.
Research scopeBrought three separate admin flows into one connected experience.
Design changeRedesigned risk-management screens went into day-to-day customer use.
Delivery outcomeA consistent platform needed more than visual polish: shared component behaviour, practical local configuration and terminology clinicians already understood.
Datix Cloud IQ (DCIQ) brought incident reporting, risk and patient safety into one platform, but its legacy tools still worked differently.
COVID-19 put healthcare teams under greater pressure, so these workflows had to become clearer and more consistent.
Mixed navigation levels and inconsistent layouts made it difficult for staff to know where they were or what to do next.
Vanishing menus and unclear system responses interrupted tasks and left staff unsure whether an action had worked.
Without shared components, product teams solved the same interface problems separately. We needed patterns they could reuse.
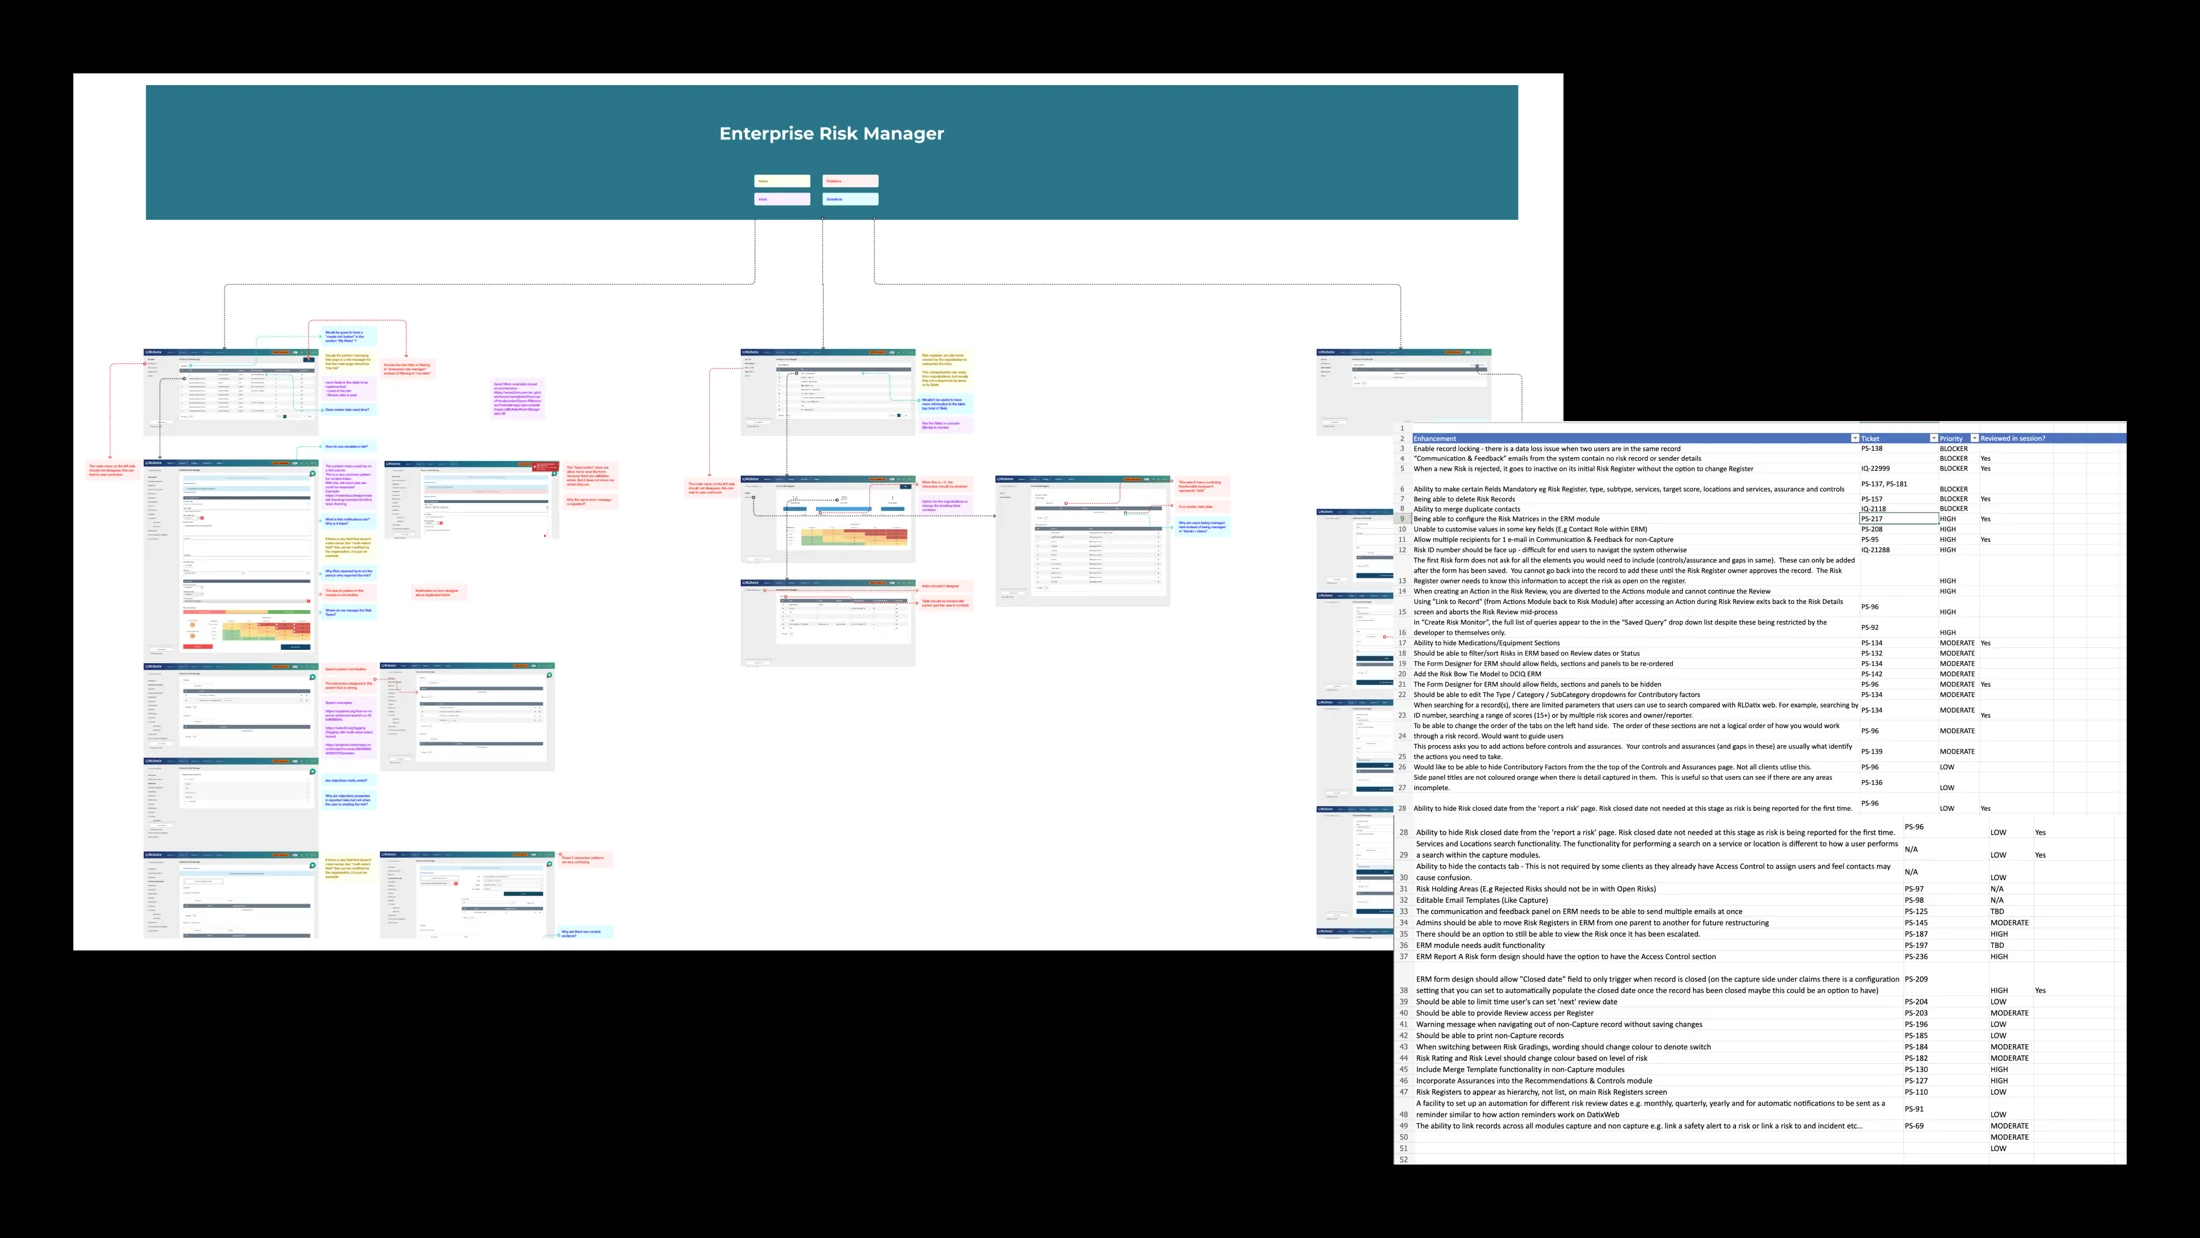
The audit showed the same problems across navigation, forms and tables, so one fix could improve many screens.
Clinicians and client teams showed us where navigation, forms and feedback got in the way. Those problems set the priorities for a shared library.
I worked with Engineering on reusable navigation, forms, tables, icons and status messages.
Reusable foundations for clear actions, familiar navigation and consistent feedback.
Component examples from the shared library

| Risk | Owner | Status | Next action |
|---|---|---|---|
| Clinical handover | Governance team | In review | Review controls |
| Reporting guidance | Quality team | Approved | Publish update |
| Staffing escalation | Ward lead | Overdue | Confirm owner |
Teams needed a quick view of what needed attention, and the detail behind it. So we paired a risk overview with detailed lists.
The matrix groups risks by likelihood and impact, so teams can scan the overall picture.
Owners, status and overdue actions show who needs to follow up.
Detailed tables remain available for reviewing each risk and its next action.
Four screens show how a staff member could report an incident and see what needs attention.
Choose the event that best describes what happened.
Check the details before you send it to your team.
Keep owners, due dates and status together.
Staff needed a clear route from an event to the right report, so I used labelled icons and categories. Client teams needed to manage local options, so I brought three configuration flows into one.
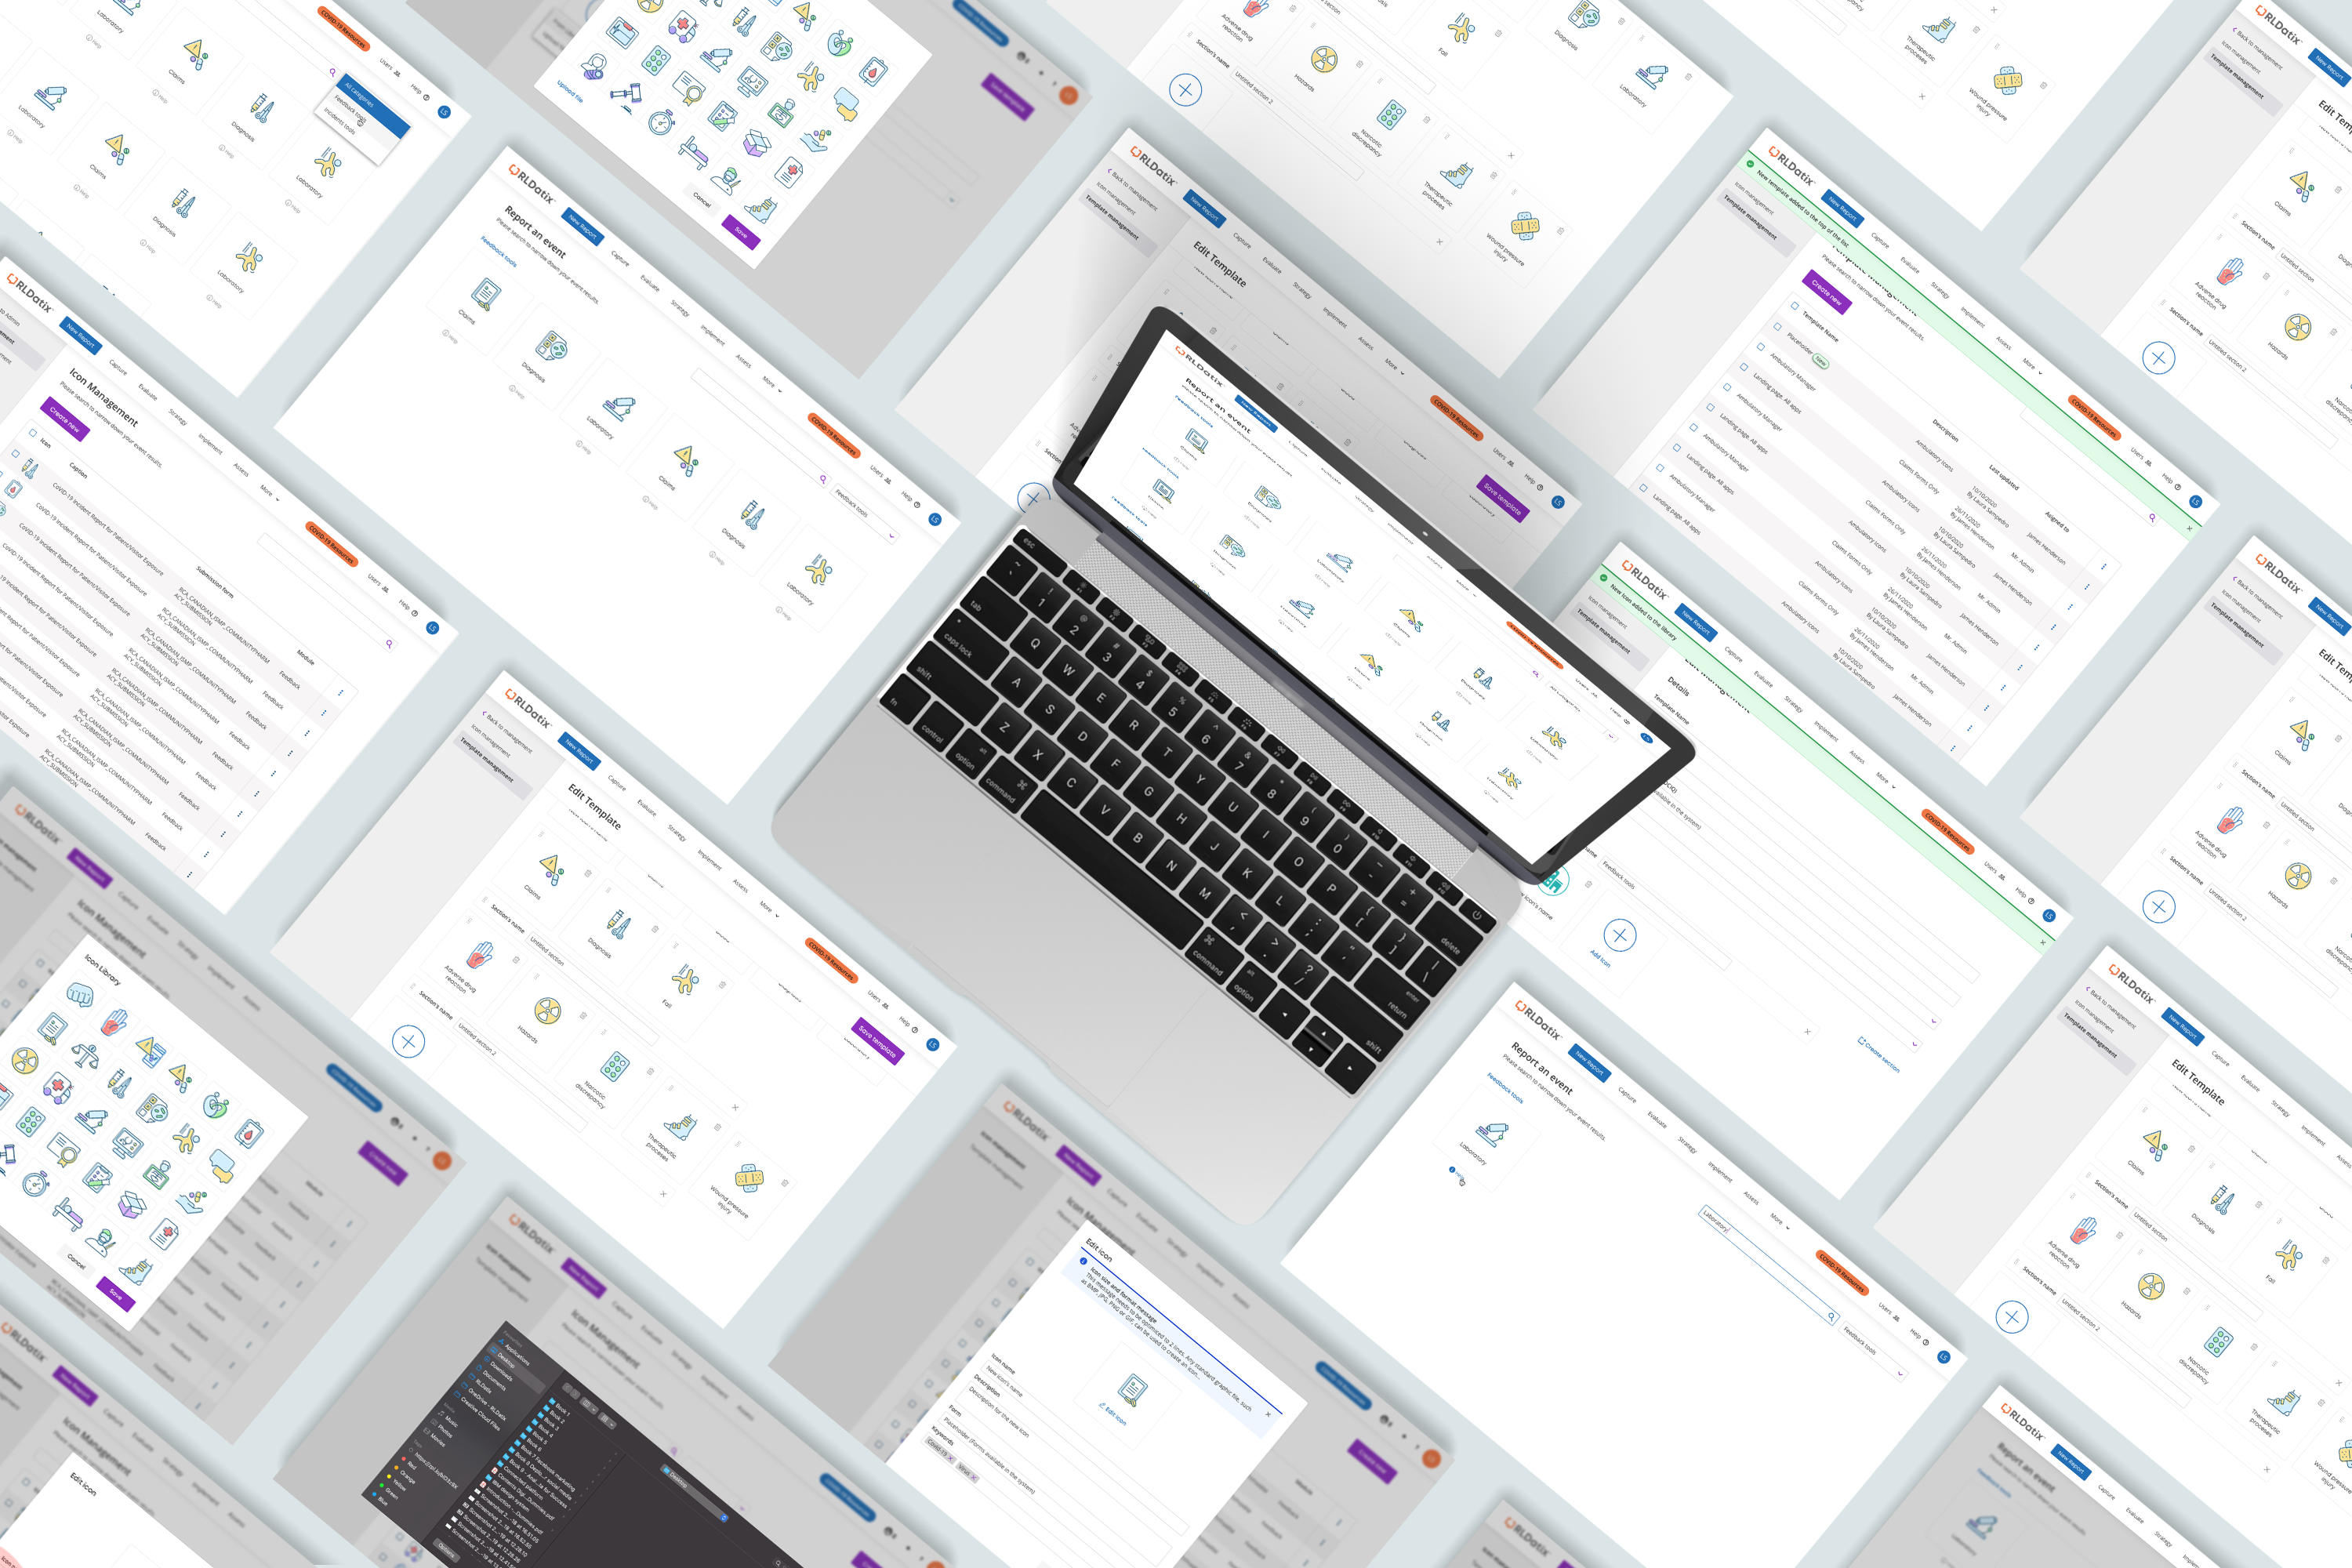
Part of the original clinical icon library.
Swipe to explore the four parts of the experience.
I tested the designs with healthcare professionals and used their feedback to decide what to keep, change and improve.
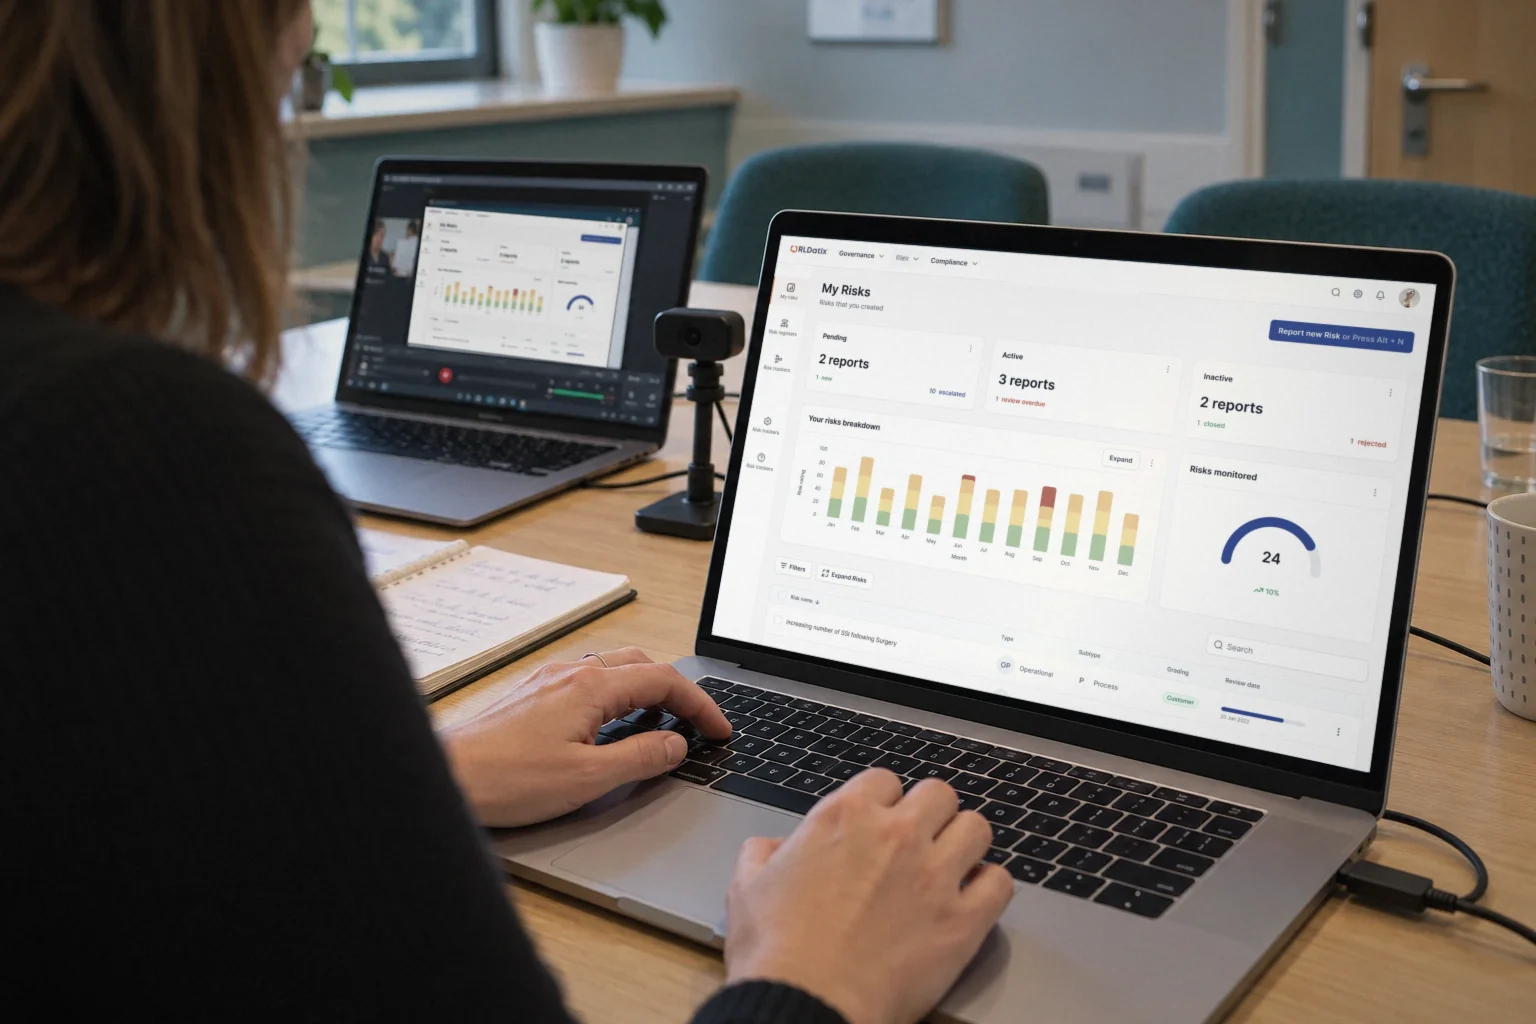
Could “Grouped Risks” make “Risk trackers” easier to understand?
Clinicians already understood “Risk trackers”. A new label added confusion.
I kept “Risk trackers” and improved navigation hierarchy and the visibility of risk actions.
Simplifying the interface doesn’t always mean changing its language.
Sessions highlighted navigation and dashboard content that needed work.
Printing, sharing and a personal dashboard became priorities for later work.